Chapter 3 Building Options Strategies
We can do a lot more with options than just buying or selling one put or one call. Stocks, calls, and puts are the basic building blocks that we can combine to construct investments with any payoff structure we want. There are tons of options strategies, and they’re all just combinations of these building blocks. You don’t need to know their names to understand their strengths and weaknesses, and the goal of this chapter is to show you how to construct options strategies on-the-fly that have the payoff that you want. In the next few chapters, we’ll talk about the greeks, which are the tools we need to understand payoff diagrams and how they change before an option’s expiry date. For now, let’s nail down how to construct payoff diagrams for strategies on expiry dates and why you might prefer certain payoff diagrams over the one offered by just owning shares.
3.1 Protective Put
A protective put combines owning shares of a stock with buying puts on the same stock. The goal of this strategy is protect the stock position against potentially large losses. The payoff diagram has two dotted lines. The first shows buying a put at the $180 strike for $16/share. The second shows buying 1 share at $200. The solid line, the protective put, combines the two dotted lines.
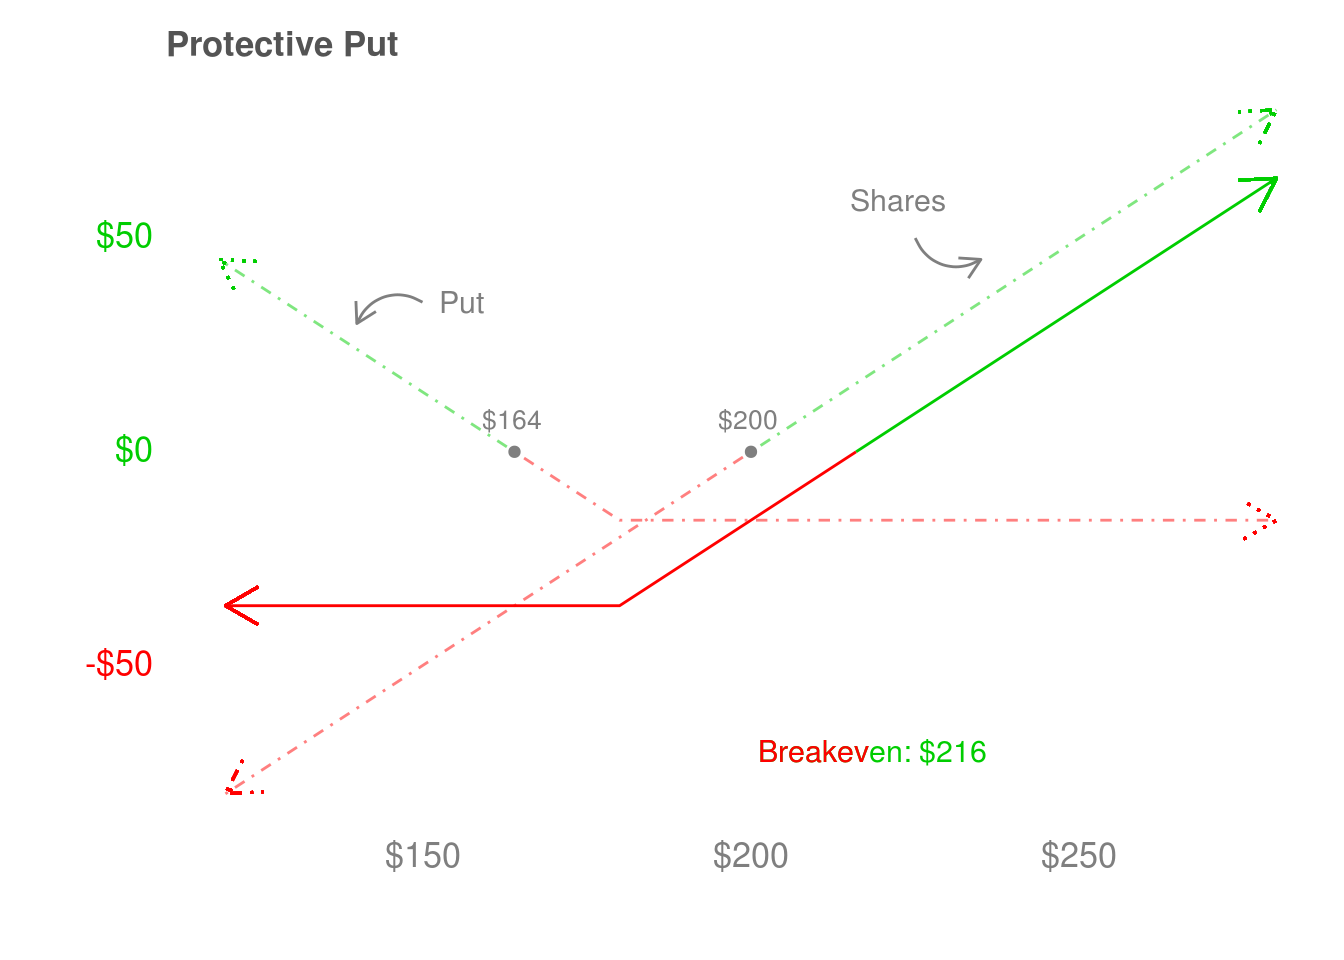 Let’s look at the $180 strike put first. It goes up dollar-for-dollar as the stock falls below $180. The stock (always) goes up dollar-for-dollar, so below $180 the put and stock cancel each other out. The protective put captures this, as it is flat below $180. Above $180, the put’s payoff does not change while the stock goes up dollar-for-dollar. The protective put goes up dollar-for-dollar above $180, but is parallel to the stock because the put cost $16/share. This makes the payoff of the protective payoff $16 less than the stock. This is also reflected in its higher breakeven of $216 = $200 + $16.
The takeaway is that we can use a put to “cancel out” losses from buying shares that are below the strike price of the put (on the expiry date of the put). Also, breaking up the payoff diagram based on the behavior of the options we’re considering is a fundamental strategy that we’ll be repeating every time we encounter a new options strategy. It will be more familiar over time, and let you construct trades with your desired payoff structure relatively easily.
A cautionary note: the payoff diagram doesn’t capture how likely these two outcomes are. They’re uncertain future outcomes and we don’t know which one will happen ahead of time. If we did, there would be no reason to buy the protection the put offers. There are a number of reasons why someone might want the protection – if they were concerned about a possible market decline, if they were too stressed about their investments and wanted to remove some risk (they could also just sell some shares if this were the case), if they were deliberately constructing a portfolio with certain risk-reward characteristics and buying puts on some positions allowed them to do so, and so on.
The first reason seems interested in how likely the put is to be profitable, but it’s just a feeling someone has. While investment professionals may have models that help them predict this, most of us don’t. A feeling isn’t predicting the future. It’s just an emotional response to possible future outcomes. So really, all of these reasons consider a possible future where we don’t know how likely the stock is to go down. The purpose of the protective put is not only to potentially save you money, but also take away the chance of losing money and reduce the stress you might feel from not knowing if the stock might crash.
Here’s something to think about: which of these two scenarios is the protective put to be more successful? The first is when the stock goes up by $20 and the put expires worthless, so we bought protection but didn’t need it. The second is when the stock falls by $50 (from $200 to $150), and the put makes it so that we lose $36 instead of $50. It’s $36 because we paid $16 to buy the put, and we lose another $20 before the protection of the $180 strike put kicks in. Is the protective put successful when the stock declines and we end up needing the protection, or when the stock goes up and we removed the risk at the cost of making slightly less money?
3.2 Covered Call
A covered call combines owning shares of a stock with selling calls on the same stock. The goal of this strategy is yield enhancement: repeatedly selling calls against a stock we already own gives us extra cash every month. This payoff diagram has two dotted lines – buying shares at $200 and selling a call at $8/share. The solid line, the covered call, combines the two dotted lines.
Since we’ll be buying and selling options in these strategies, we need an easy way to refer to if we bought or sold them. We say we’re long if we buy something, and short if we sell something. When we buy a call, we say we’re long a call or have a long call. When we buy a put, we say we’re long a put or have a long put. But remember, puts make money when their stock goes down. So saying we’re long a put doesn’t mean we make money when the stock goes up. It means we bought the put.
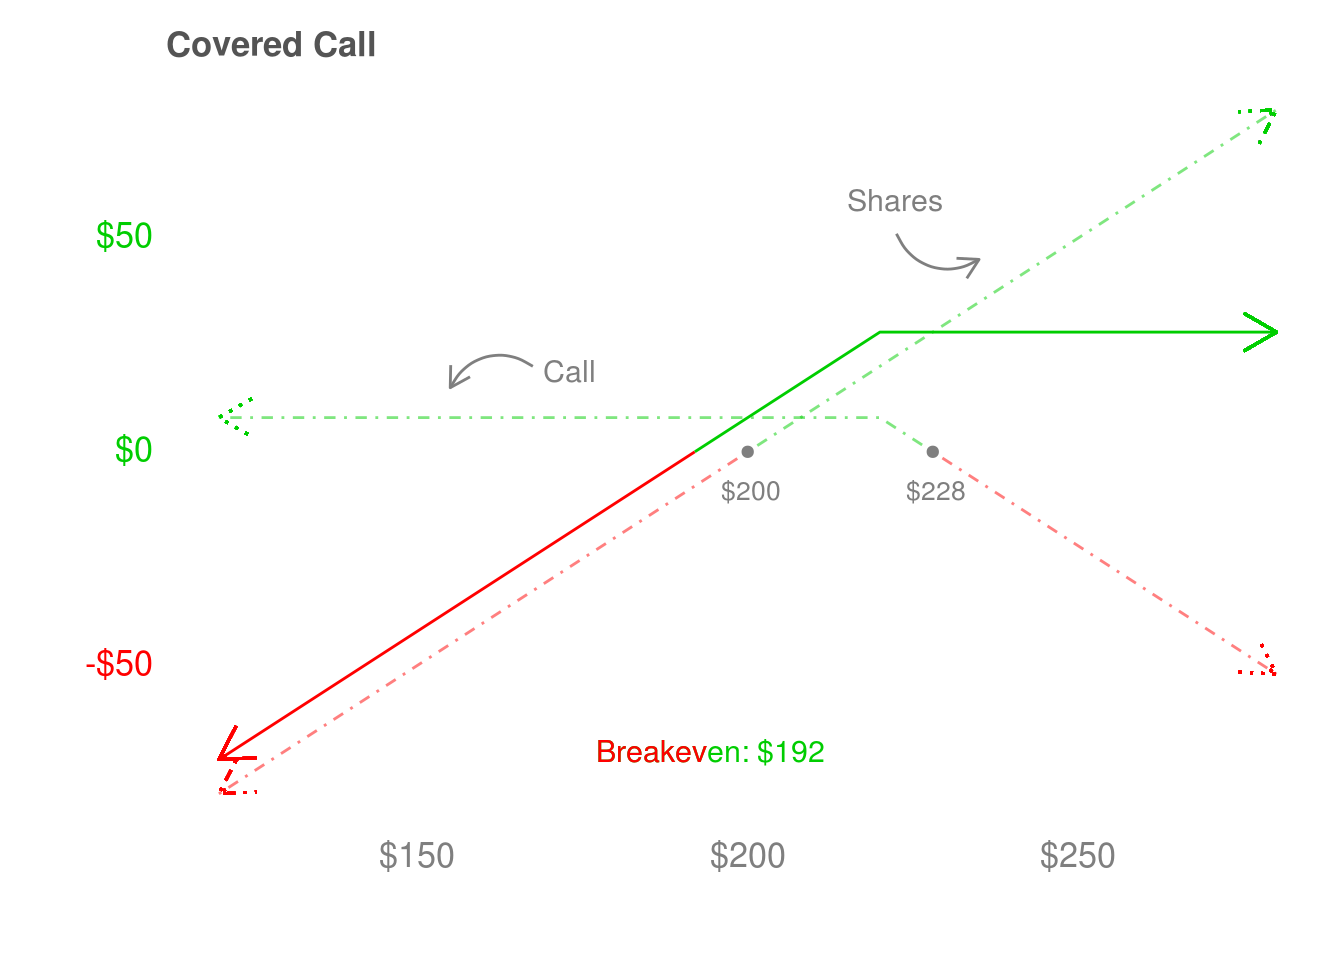 Just like last time, we’ll break up the payoff diagram into two sections: above and below the strike price of the option. We sold the call, so we have a short call at a $220 strike. Before $220, we make $8/share from selling the call. That makes the covered call, which combines owning shares at $200 with selling this call, $8/share more profitable than just owning shares. The payoff diagram shows the covered call shifted upwards, compared to just owning the shares. After $220, the call loses a dollar-for-dollar what the shares make, and so the covered call flattens out. We bought the shares at $200 and sold the call at the $220 strike, so we make $20/share from owning the shares before the short call kicks in. We still make $8/share for selling the call, for a maximum gain of $28/share. The cost of collecting $8/share in income is that we “canceled out” all potential gains from the shares going above $220.
If we open a covered call, we probably don’t want to sell the shares and keep the call. The risk is that the stock goes through the roof, to say $250. The person who owns the $220 strike call will exercise it. Since we sold the call, we’re obligated to deliver the shares to them. If we don’t own the shares, we have to buy at $250, and sell at $220 to fulfill our commitment. We’ll lose $30/share, and if the stock goes higher than $250 we’ll lose even more. To avoid the potential for those kinds of large losses, we have to view the shares and short call as a package deal – if we own one, we own the other.
If the stock falls below $192, the covered call loses money, but it loses less than than just owning shares. Your perspective on if this is a good outcome might depend on why you entered the trade. If you view the stock as a long-term holding, you’ll likely hold through a decline, so the $8/share of income you collect is a bonus. While you’re not happy the stock is below $192, you’re probably happy the call let you recoup $8/share of those losses. You might even consider selling another call to help recoup more of your losses. If you view the covered call as a tactical position and it loses money, you’re faced with the decision of taking the loss or selling another covered call to try and recoup your losses. In this case, you probably wish you sold the covered call when the shares were above $192.
What are the favorable outcomes for a covered call? For me, the answer comes by comparing it to just owning shares. The covered call is worse above $228, and better below $228. But even it loses money below $192, which we’d like to avoid. The sweet spot for the covered call is between $192 and $228, where it’s both profitable and more profitable than just owning shares. Most people who write covered calls use it as a yield enhancement strategy, where they sell calls to produce income. If the stock stays between $192 and $220, the call expires worthless and we keep $8/share in income from selling the calls. Once the call expires, we can sell another call against our shares, and collect more income.
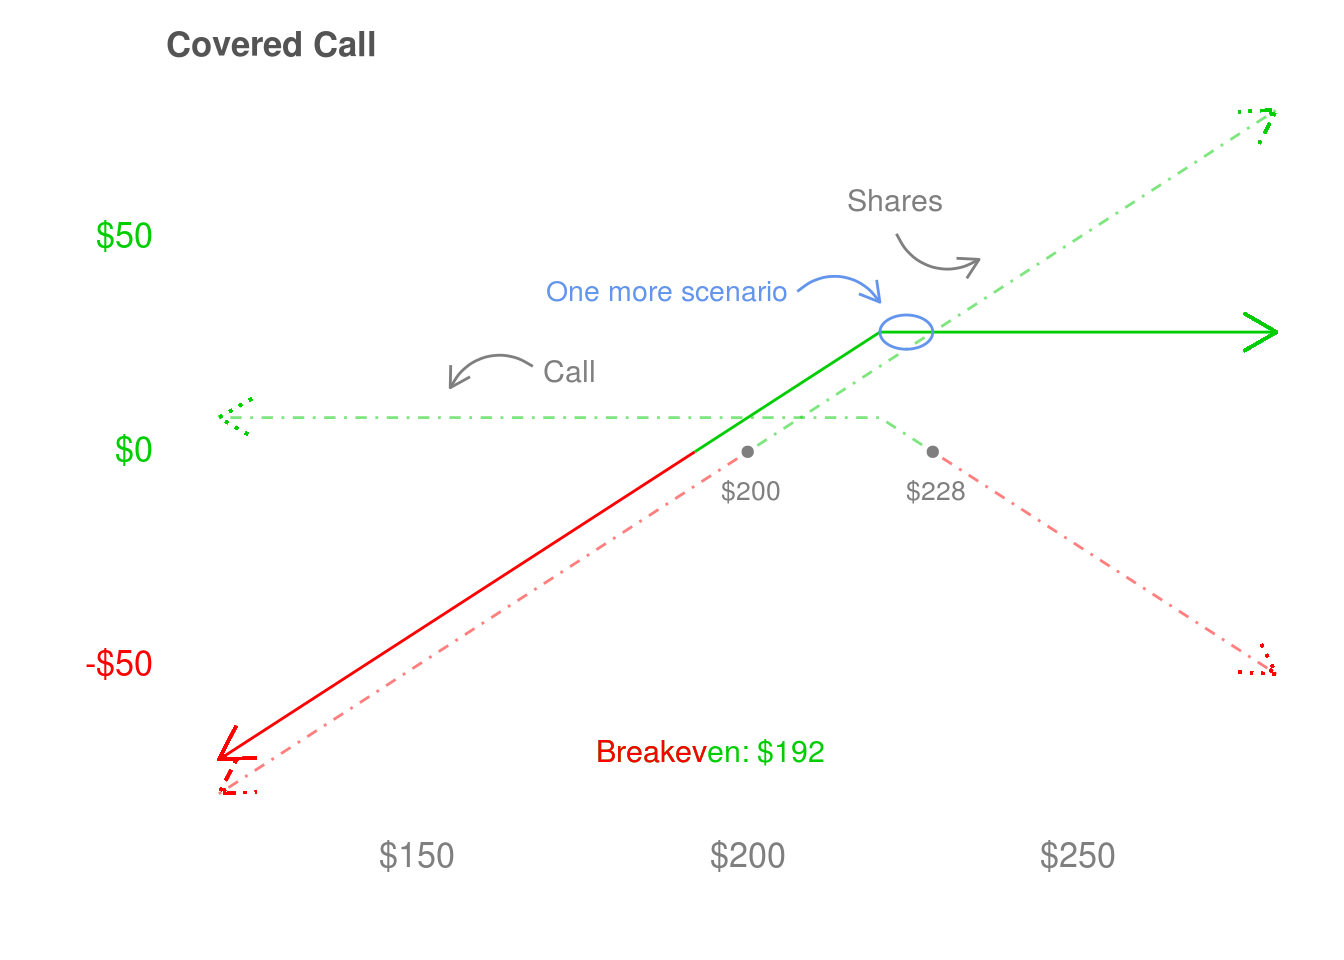 There’s one more scenario – the shares are between $220 and $228 on the expiry date. The call has a strike price of $220, so it will get exercised and we’re obligated to deliver our shares. The short call removed all upside from owning the shares above $220, but we make $20/share as they rise from $200 to $220 and $8/share from selling the call. Since we bought the shares at $200 and they’re under $228 when we have to deliver the shares, the covered call is still more profitable than owning shares. At this point, we have a decision to make – we can buy back the shares for less than $228 and possibly sell another call against them, or we can buy back the call we sold to book the profits and possibly sell another call against our shares.
Just like with the protective put, the payoff diagram for the covered call doesn’t tell me how likely these different scenarios are. I have to construct the trade based on my views about the future price of the stock, which is uncertain. Because the most favorable outcomes for this covered call happen between $192 and $220, it is a very different trade than just owning shares. When I just own shares, I just want the shares to go up. When I own a covered call, I want the shares to mostly stay where they are. Just like the protective put, the covered call changes your opinion of what the most favorable outcome of the trade is. This is the true power of options strategies – being able to construct payoff diagrams where your trade is profitable under different outcomes than just the stock going up. The covered call also produces some income and helps protect against potential losses while owning shares, which are appealing in their own right.
3.3 Straddle
The straddle combines two options positions – a long call and a long put (with the same expiry date). Unlike the protective put and covered call, we don’t own any shares in this position. The put makes money if the stock falls a lot, and the call makes money if the stock goes up a lot. The beauty of the straddle is that can be profitable regardless of the direction the stock moves, so you don’t have to get the direction right to make money. The downside is that the moves have to be large enough to pay back the cost of the long call and long put, so you’re hoping for a big market move in either direction.
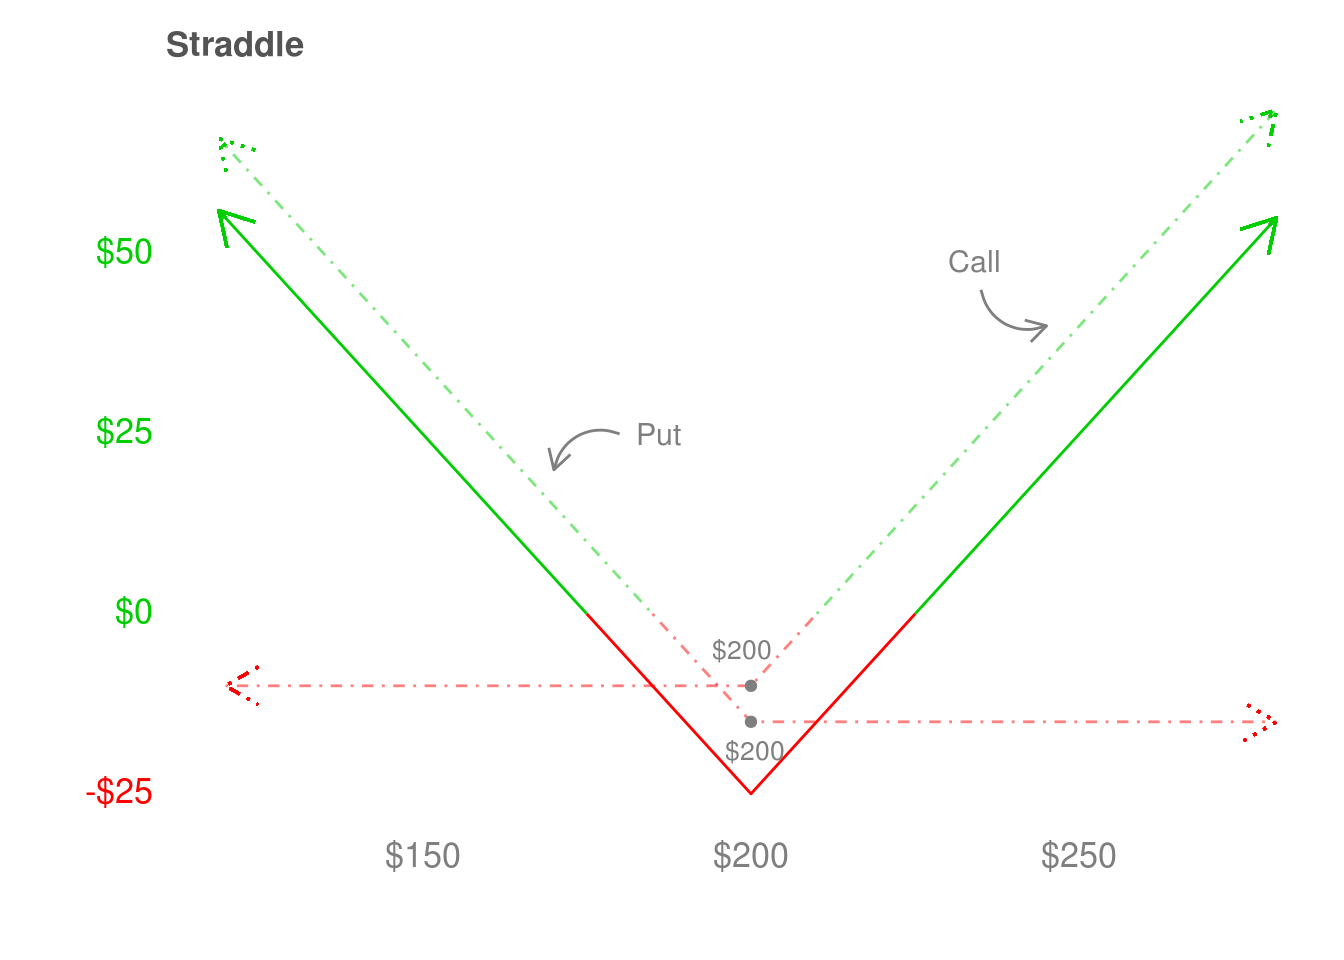 Here, we can see a $200 strike call that cost $10/share and a $200 strike put that cost $15/share. To make money, the straddle has to make enough to cover the $10/share the call cost, and the $15/share the put cost. It can do that by moving more than $25 in either direction – below $175 if it heads lower, and above $225 if it heads higher. The protective put removes the downside risk associated with owning shares, and the covered call produces income by selling calls against shares you already own. The straddle consists of two options – a call and a put – and no shares. We’ll get into more details about volatility when we talk about vega in Chapter 5, but at its heart the straddle is a long volatility trade. The optimal outcome is that the stock moves a lot, either up or down. It doesn’t matter which.
To get a better idea about how to use a straddle, we’ll consider three different traders’ views about likely future prices. Remember that these views are just opinions, and none of these these traders know where the shares will end up on the expiry date. These different opinions make some people buyers and some people sellers. Those people coming together gives us a market where people are willing to trade, so it’s a good thing. But there’s no way to know if a particular view is correct until it happens. Even worse, even if the trade is profitable, it’s not obvious how to judge if the view was was successful. The next three pictures show the problem – views describe how probable a particular price is in the future, which we can put together to tell us how likely the straddle is to be profitable on its expiry date. So even if the straddle is highly likely to be profitable, it can still be unprofitable. That means that losing money doesn’t mean our views were wrong. To get an idea of how to use our views to help make profitable trades, let’s look at three trader’s views of what the market may do.
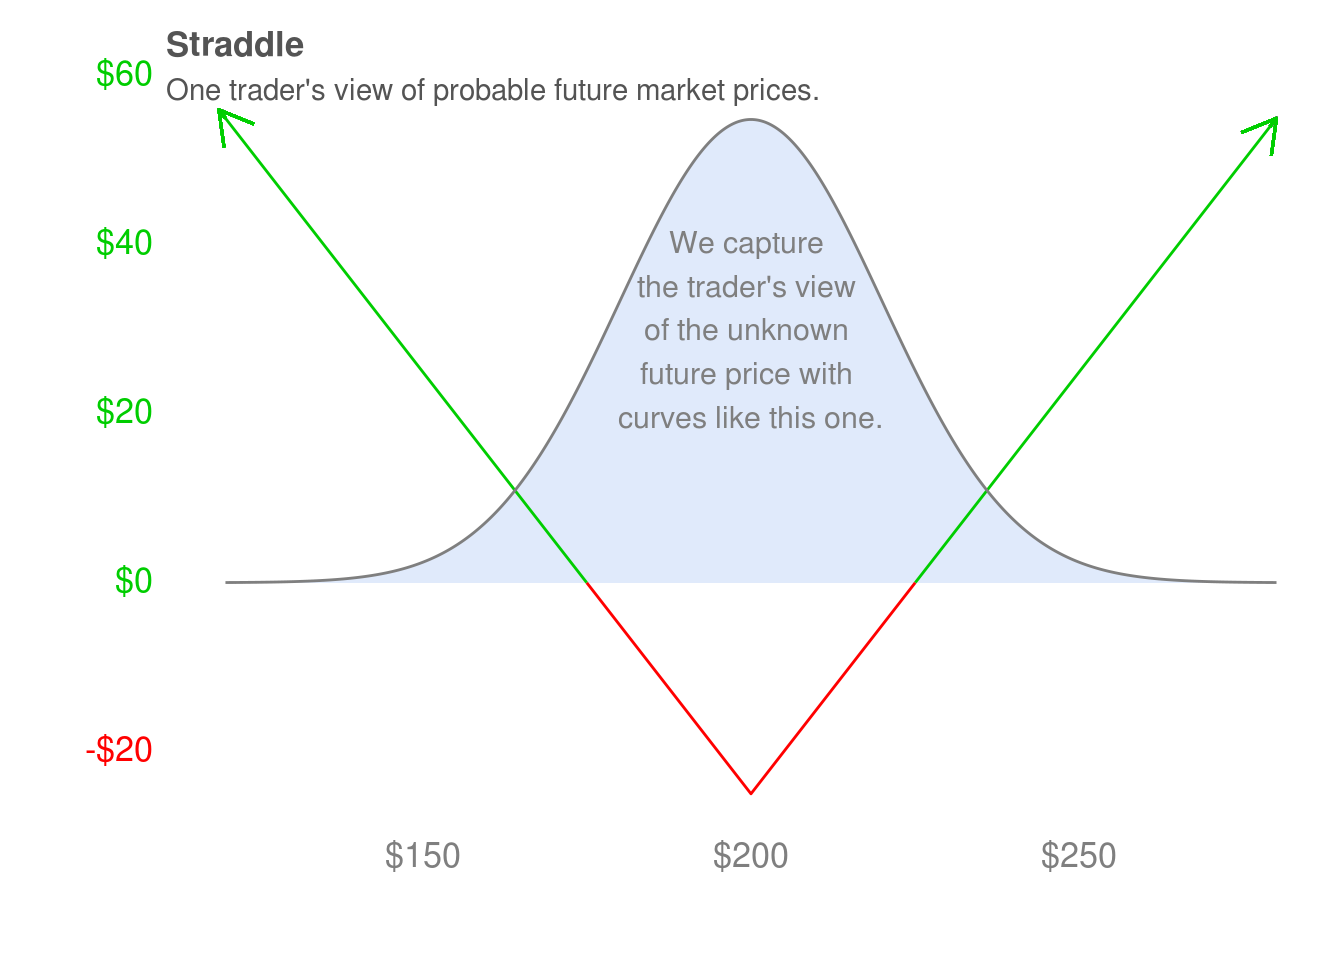 Our first trader (above) has a symmetric view – he thinks the shares are equally likely to end up above $200 or below $200. Under his views, the straddle is unlikely to expire profitably. It seems strange for this trader to buy something that he thinks is likely to lose money, so why might he buy this straddle? The most compelling reason is as a hedge against potential stock market declines. Most of us buy stocks and we make money if they go up, but have nothing to protect us if they go down. The straddle combines upside participation (via a call) with downside protection (via a put). Provided the stock goes up enough before it expires, the call allows us to be profitable while still holding the put for protection.
One major difference between a straddle and protective put is that the straddle involves buying two options that decay in value, while the protective put involves buying only one. This means we lose the entire cost of the straddle if the put and call expire worthless, while with the protective put we only lose the cost of the put. To illustrate another major difference, suppose we bought 100 shares at $200 and a put at $15/share. The shares cost $200 x 100 = $20,000 and the put costs $15 x 100 = $1,500, for a total cost of $20,000 + $1,500 = $21,500. The call costs $10 x 100 = $1,000 per 100 shares and the put $15 x 1000 = $1,500 per 100 shares. This is a total outlay of $2,500, which is significantly cheaper. Even though the two trades have different payoffs and risk characteristics, the straddle is a significantly cheaper way to enter a hedged position. That might be enough to entice someone to buy a straddle instead of a protective put. We’ll return to the straddle and discuss more differences between it and the protective put after working through the greeks in the next two chapters.
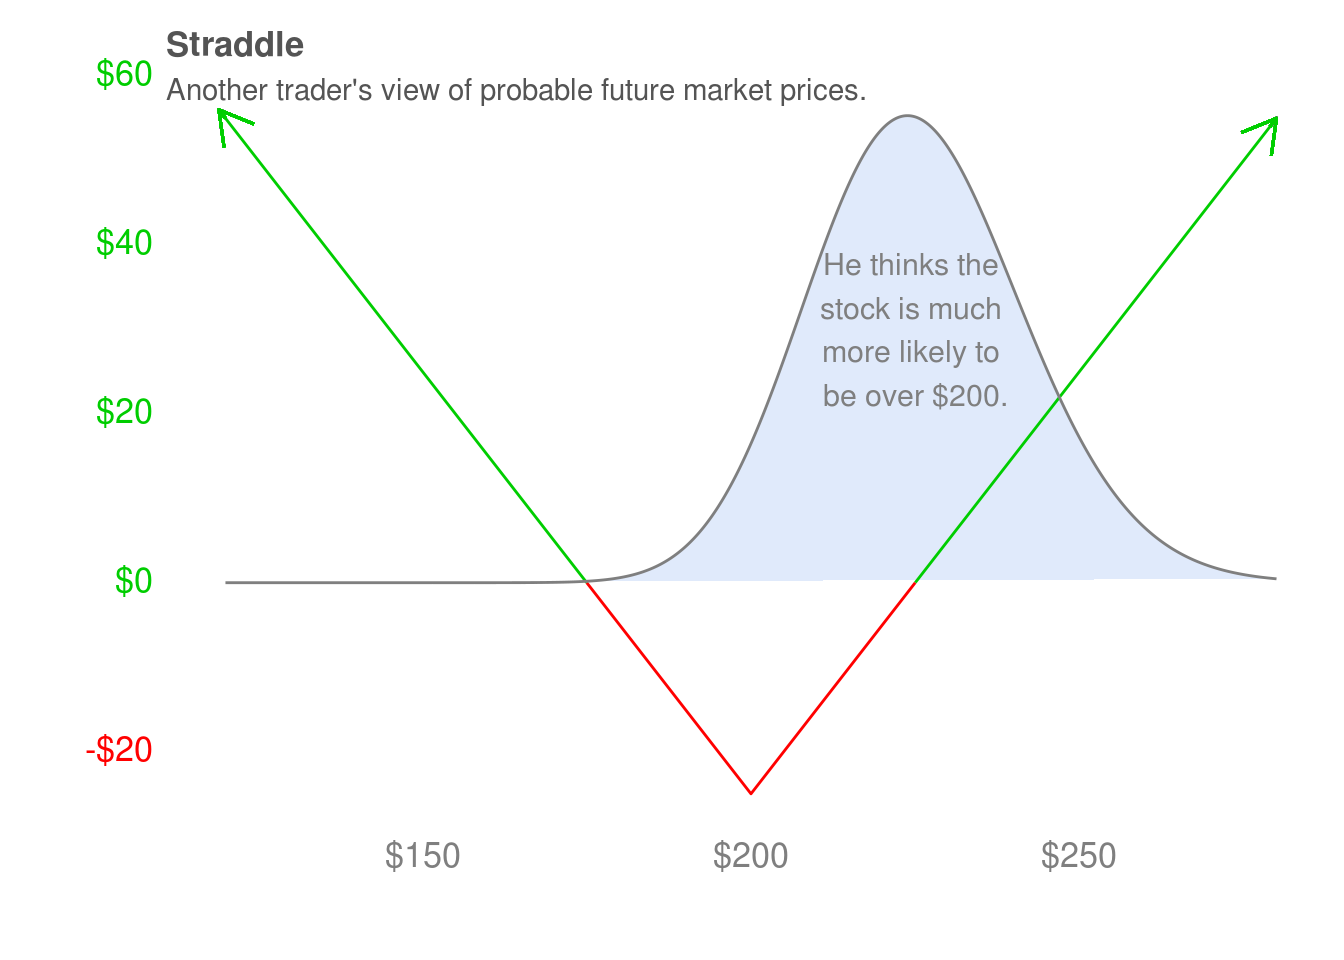 Our second trader (above) does not have a symmetric view. He considers it much more likely that the stock will be above $200 when the put and call expire, and that it is almost impossible for the put to make money. It’s extremely unlikely that this trader will buy the straddle as a hedge, but what might compel him to do it? The first thing to notice is that if he’s right and the stock heads higher, the straddle will make money. If he’s right, he makes money. If his forecast is wrong and the stock heads lower, the straddle has a good chance of making money. If this trader has lost lots of money when he had similarly confident forecasts in the past, his experience may have taught him to diversify into strategies that perform well when the “impossible” happens. Under his views, the straddle is very likely to make money as the stock goes higher. If he’s wrong and the picture above is a bad forecast, the straddle still has a good chance of making money.
Another reason to buy the straddle is that the trader may not be confident in his forecast. If he thinks his views may be wrong, he might buy the straddle to diversify the bets he is taking. In this case, another choice is to not buy the straddle and instead search for investment opportunities where he is more confident in his forecasts. When we revisit the straddle to see how its payoff diagram behaves before its expiry date, we’ll see this trader’s views (if correct) will help him “defend” the straddle. We often don’t want to hold an options position to expiry and run the risk of losing our entire investment. There are a truly enormous number of ways to adjust options positions to manage this risk. We’ll talk about some of them later in the book.
If it’s available, one simple adjustment is to use the profits we get when the shares go higher. Suppose the shares are at $240 and the straddle is profitable by $10/share one month before expiry. We can sell the straddle and use the proceeds to buy another at the $240 strike that is three months from expiry. That adjustment lets us stay in a straddle for another few more months. We can, of course, repeat this adjustment as many times as we want to stay invested in a straddle indefinitely. As long as the stock keeps going higher (or lower) fast enough, we can make money on each adjustment. When the stock doesn’t move enough before we need to make an adjustment, we’ll lose money to defend the position and push the expiry date further out.
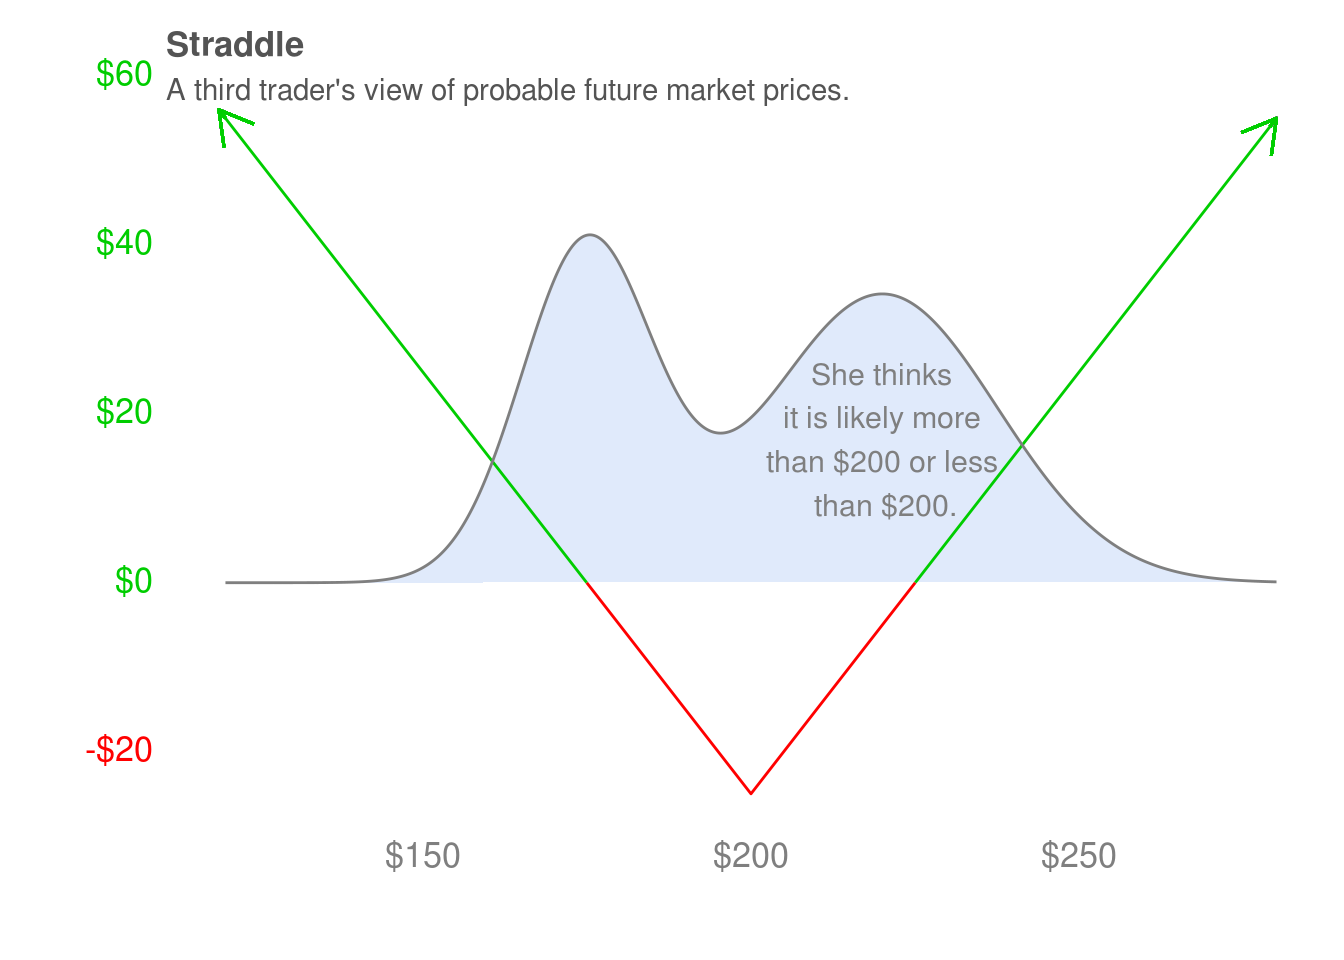 The third trader (above) has a more complicated view of possible future prices. She thinks that the stock is unlikely to stay near $200, and that it is very likely to move towards prices where the straddle is either profitable or where the position can be defended at a reasonable cost. Of the three traders we’ve considered, she has the best risk-reward on the straddle. She may buy it not at a hedge against unlikely events occurring or the unlikely scenario of unforeseen catastrophic loss, but to gain exposure to the superior risk-reward profile illustrated by the payoff diagram that describes her views.
3.4 Collar
In the covered call, we bought 100 shares and sold 1 call. In the protective put, we bought 100 shares and bought 1 put. In the collar, we combine these two strategies: we buy 100 shares, buy 1 put, and sell 1 call. The idea here is that we want the protection offered by the put, but we want to offset the cost of the put so we sell a call too. To break down the collar, I’ve shown two payoff diagrams. The first focuses on its left-hand side, and the second focuses on it’s right-hand side. I’m going into that much detail to show how the put and call work together to create the collar, but I wouldn’t recommend thinking about the collar in quite that way.
An easier way is to combine the knowledge we have about the protective put and covered call. The protective put involves buying a put that “cancels out” some of the potential downside from owning shares, and the covered call “cancels out” some of the potential upside from owning shares. That’s the exact behavior we see on the left-hand and right-hand side of the collar, which we can use to reconstruct the collar. It consists of owning shares, owning a put with a strike price where the payoff diagram flattens out on the left-hand side, and owning a call with a strike price where the payoff diagram flattens out on the right-hand side.
The two payoff diagrams we’ll look at are for the same scenarios we considered when looking at the protective put and covered call. We buy the shares at $200, buy the $180 strike put for $16, and sell the $220 strike call for $8.
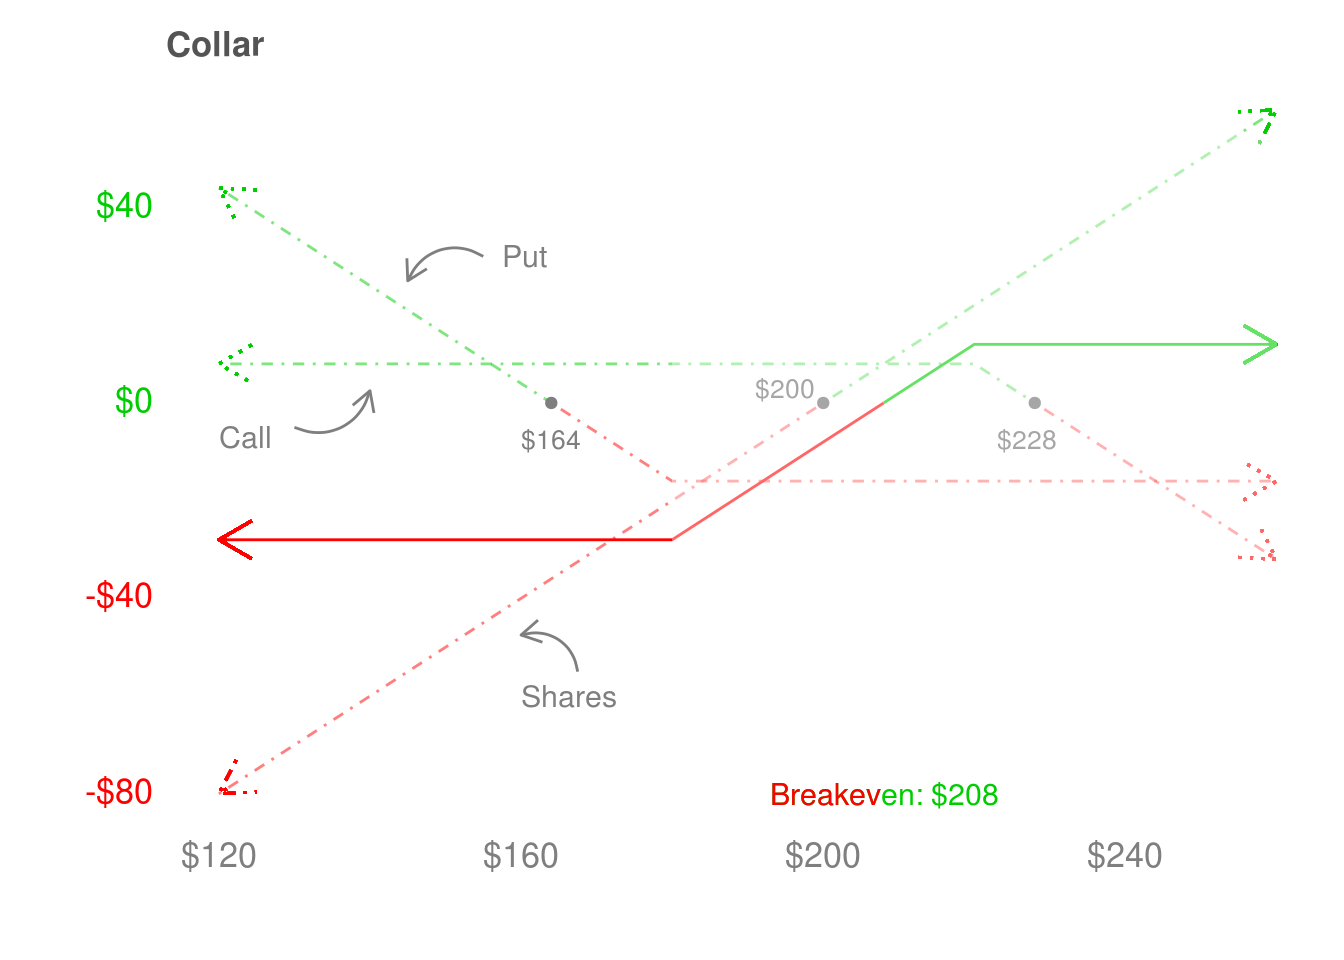 Let’s look at the left-hand side of the payoff diagram (above) first. It’s a little busy, so you might not be able to follow it right away, but let’s break it down. There’s a short call, which is profitable but flat. It shifts the payoff of the collar up, but does not do anything else. There are shares and a protective put, which “cancel out” after the $180 strike price of the put. We still lose $20/share as the shares fall from $200 to $180 (before the put kicks in), plus $16/share from buying the put. We make $8/share from selling the call, for a total loss of $20 + $16 - $8 = $28. We lose $28 whenever the shares are below $180, since the put removes any potential loses below $180. This is less than the $36 we would lose if we had not sold the call – the $8/share we collected by selling it pays for half of the $16/share the put cost.
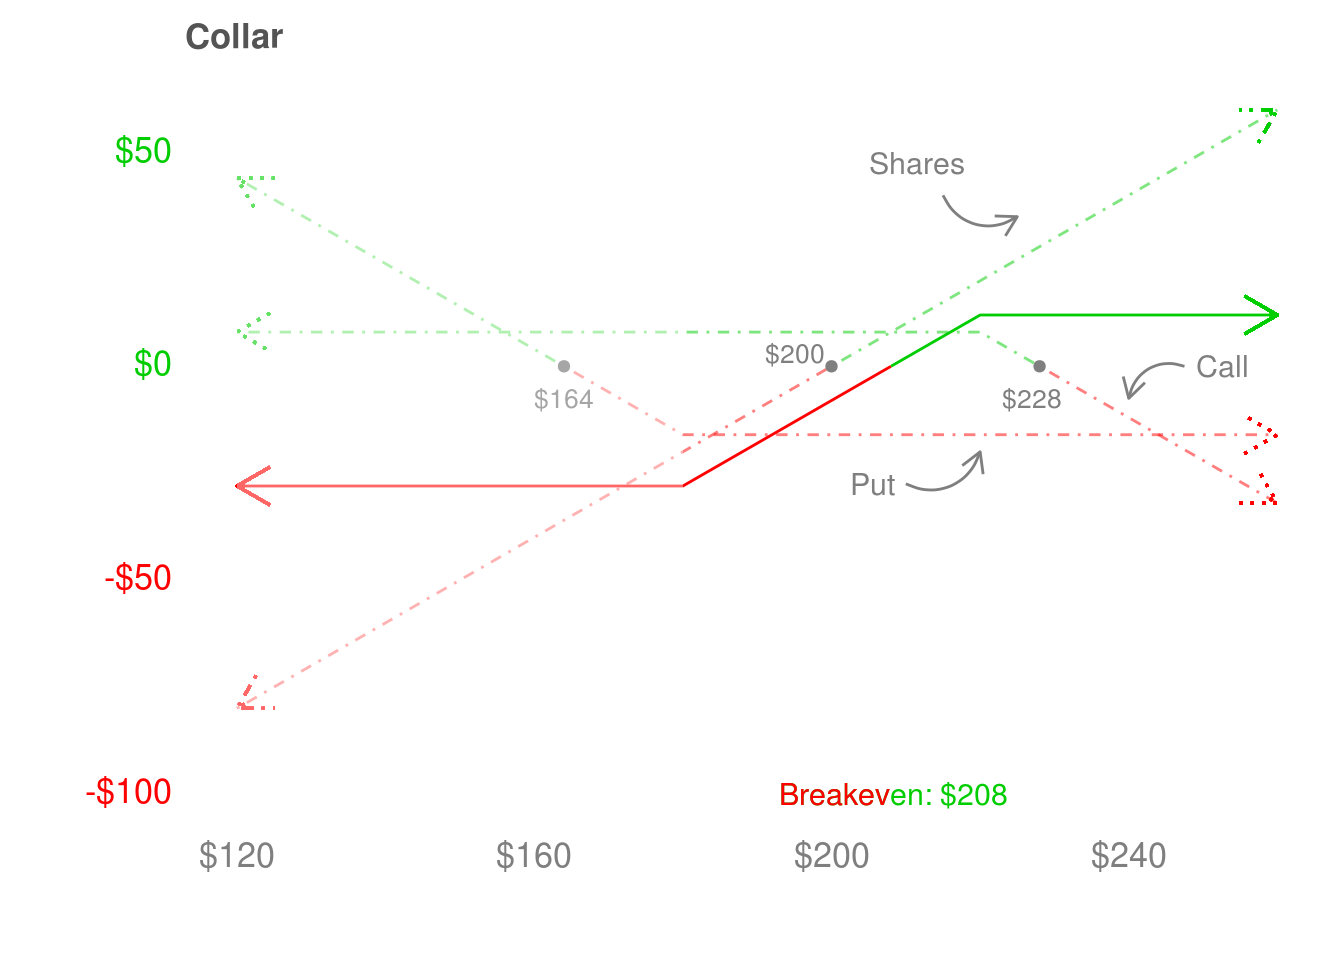
The right-hand side of the payoff diagram (above) looks at what happens when the shares are at $180 and above. It is a little more complicated than the left-hand side, because there are two different regions to consider. Between $180 and $220, the $180 strike put or $220 strike call only influence the collar by shifting its payoff diagram down by the $8 the long put/short call combo cost. We bought the shares at $200, so the collar breaks even at $208 after it recovers that $8 cost. It becomes more profitable up until $220, when the short call cancels out any additional potential gains the shares could provide.
The two major disadvantages of the collar are that it can increase your breakeven, if the put is more expensive than the call. You can chose to construct collars so that they don’t increase your breakeven – this involves buying either a cheaper put (that offers less protection) or selling a more expensive call (that gives up more potential upside). Both of these are undesirable, so another approach is to only employ the collar when calls are relatively expensive compared to puts. Stocks tend to have very expensive puts, but commodity ETFs like GLD have much more favorable options pricing for this strategy. One could seek to execute collars only for commodity ETFs (and the rare stock) that give favorable pricing.
Suppose we’re entering a trade on GLD. We’re viewing every trade we make as a bet that our view will be profitable, preferably prior to our options expiring so that we do not have to defend the position. If we’re entering a trade on GLD, we may want to limit the downside while being able to lock in enough of the upside to move the strike price of the put and call higher. If we can do this successfully a few times, we will have locked in enough gains to be confident the GLD trade will be profitable even without the put and remove the collar. When we do this, we’re viewing the gains we’ve already made by running the GLD collar as enough protection to not worry about the downside in owning GLD.
The key idea here is that when put and call pricing is favorable, entering a collar gives reasonable upside (for GLD, perhaps 10%) while limiting our downside with the protective put. If the trade goes against us, we will lose much less money than if we had just bought shares, and if the option pricing is favorable we’re still able to participate in enough upside to remove the collar after one or two adjustments that move the strike price of the call and put higher (and perhaps move the expiry dates out).