Chapter 4 Thinking in Greeks I
Payoff diagrams are fantastic visuals, but the ones we have looked at only tell us about the performance of the option on its expiry date. If we’re interested in earlier dates, we need to upgrade the payoff diagram. That’s our task in this chapter.
4.1 Delta
Here is one of the first payoff diagrams we saw. It shows us when we’ll lose money, when we’ll make money, and when we’ll switch from losing money to making money. But it tells us even more – it gives us the delta of our investment.
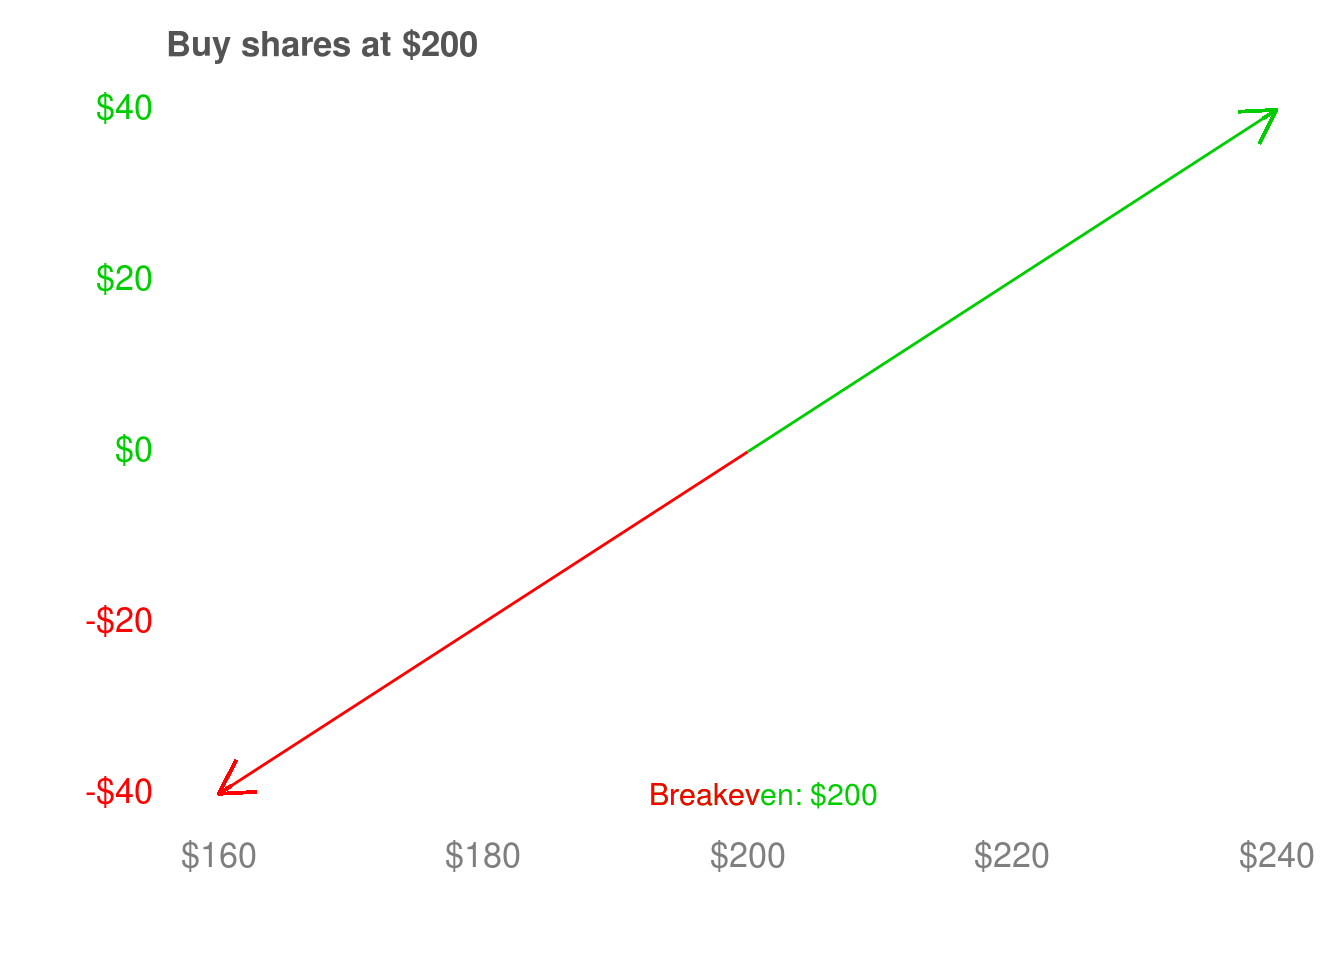 Delta is how much we participate in a stock moving up or down. If we own the stock, we make $1 for every $1 the stock goes up, and lose $1 for every $1 the stock goes down. We call a stock a delta 1 asset as a shorthand way of describing this dollar-for-dollar relationship. We’ve looked at the payoff diagram of options on their expiry date, and how they participate dollar-for-dollar in the performance of their stock once they’re past their strike price. As a quick refresher, we looked at this call option. Below it’s strike price of $200, the call expires worthless. It doesn’t go up or down in price – it is delta 0. Above it’s strike price, it participates dollar-for-dollar in the stock’s price movements – it is delta 1.
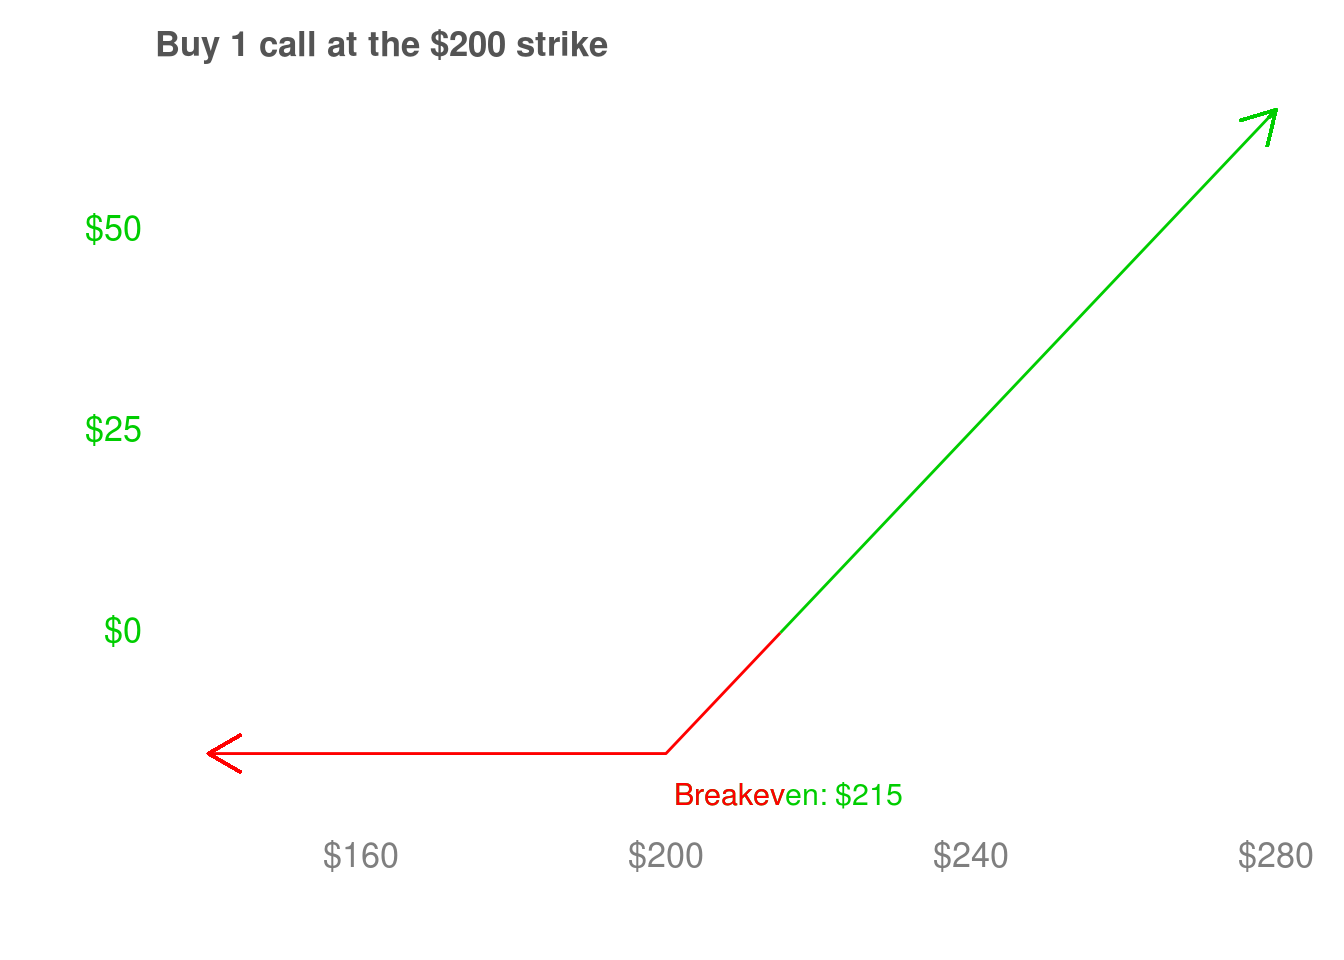
Just a quick reminder – try not to confuse the strike price of $200 with the breakeven of $215. For a call, the strike price is the price you have the choice to buy shares at. These calls cost $15, so we have to make $15 to get to breakeven before the call becomes profitable. But we start going up dollar-for-dollar at $200 so that we make $15 back and reach breakeven at $215.
We’ve seen stocks, which are delta one. We’ve seen calls on their expiry date, which have a delta of zero below their strike price and a delta of one above their strike price. Similarly, puts are delta 0 above their strike price since their price does not change. They are delta -1 below their strike price, because they make $1 for every $1 the stock goes down. What about before their expiry date? It depends on how far the puts or calls are are from expiring. We’ll look at the payoff diagram of the $200 strike call 3, 6, and 12 months before it’s expiry date.
Before getting into it, a quick note – the cost of a call varies depending on how far away from expiry it is. The intuition is that the closer a call gets to expiring, the less time the stock has to go up. This reduces the chance the call has to be profitable, and so it loses (time) value every day. We’ll get into the details of how that works when we talk about theta and vega. For now, suppose we have bought a call for $15, and that we hold it until it is 3, 6, or 12 months from expiry.
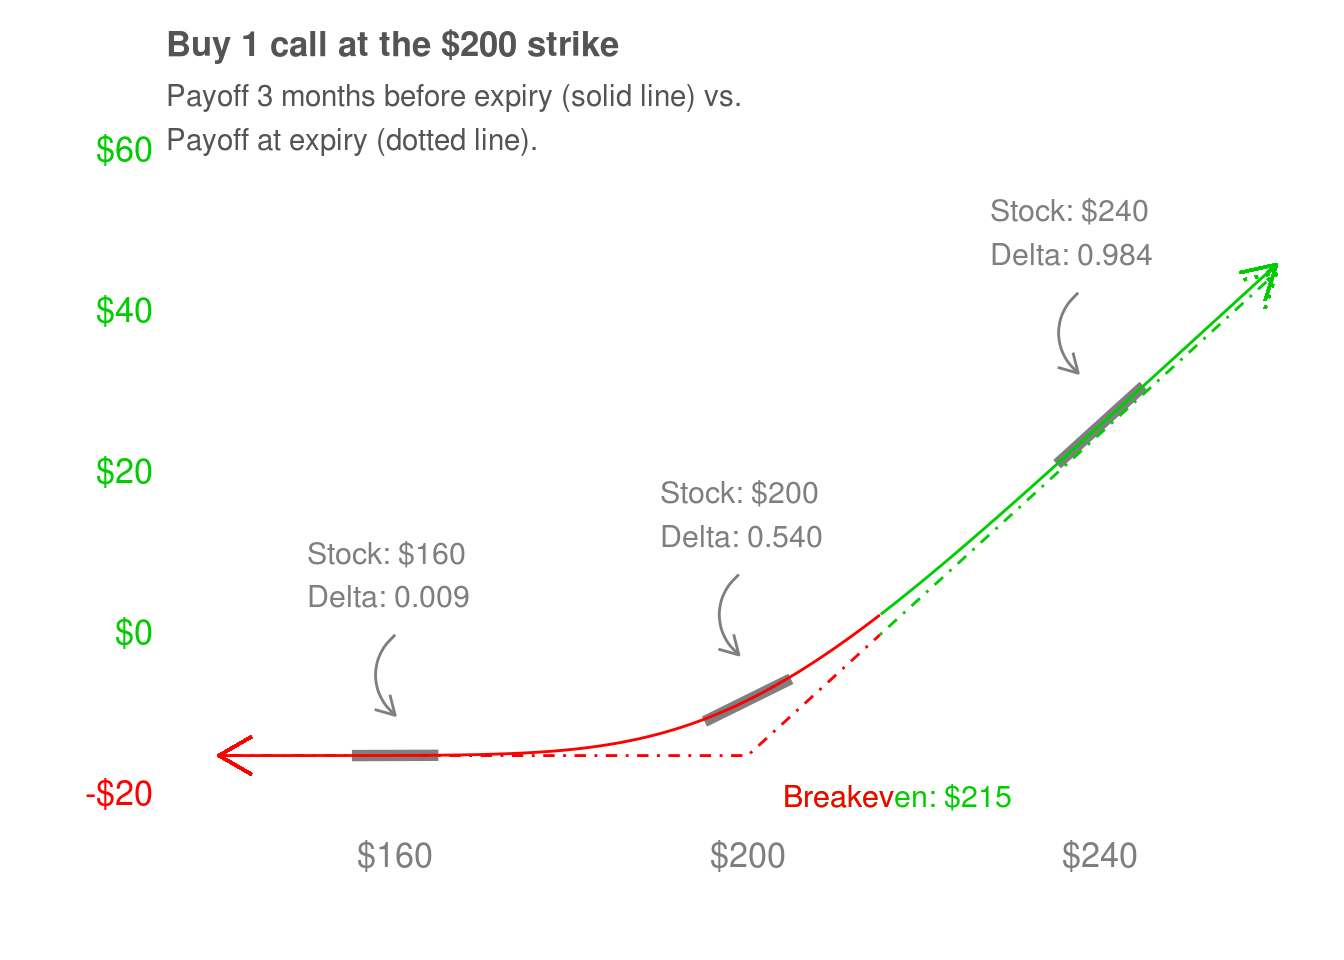 This call is 3 months from expiring. The
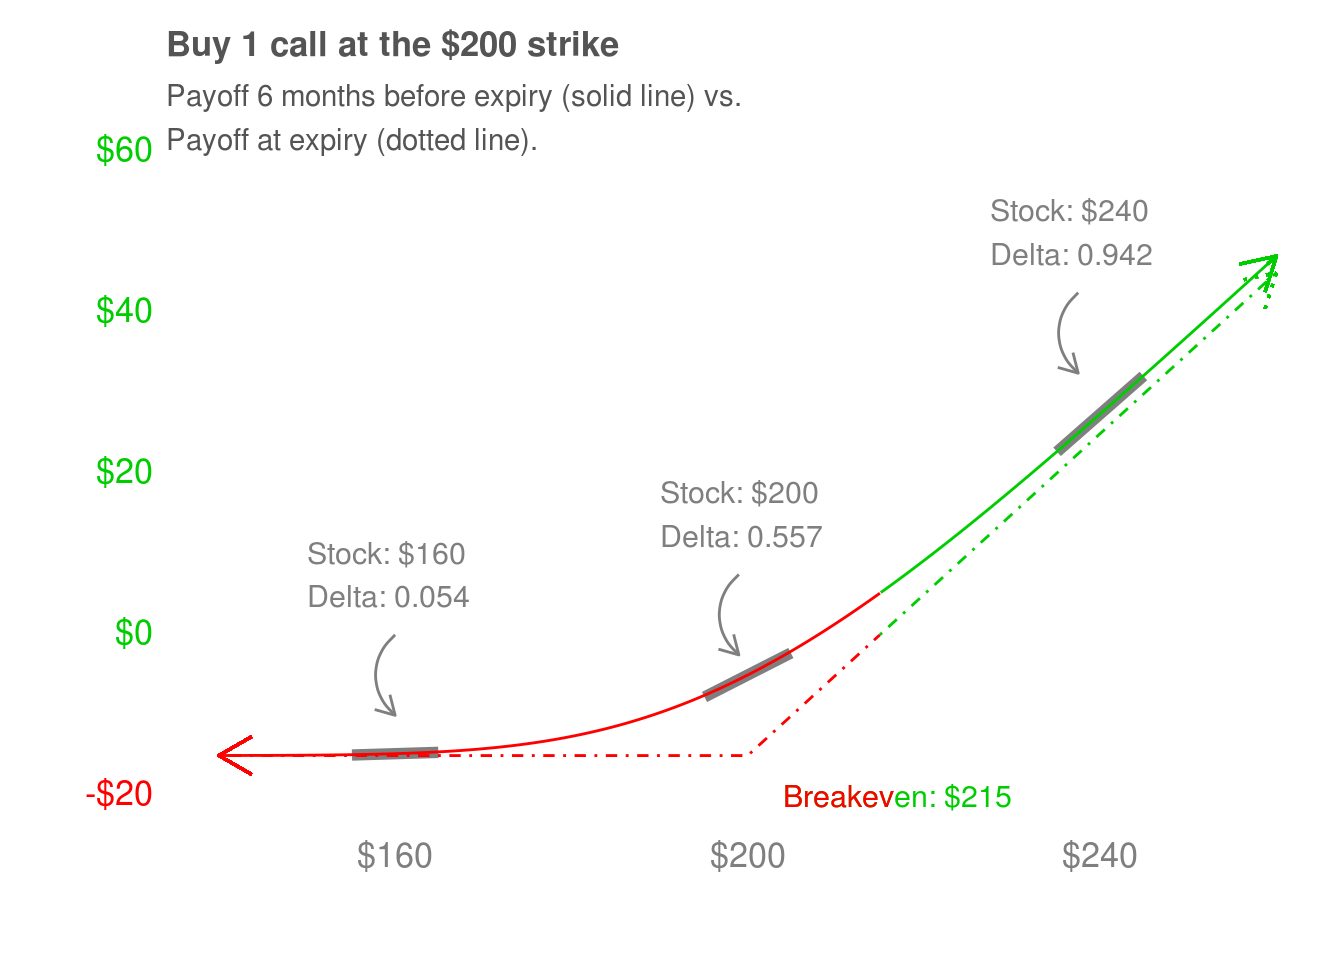 Add.
Add.
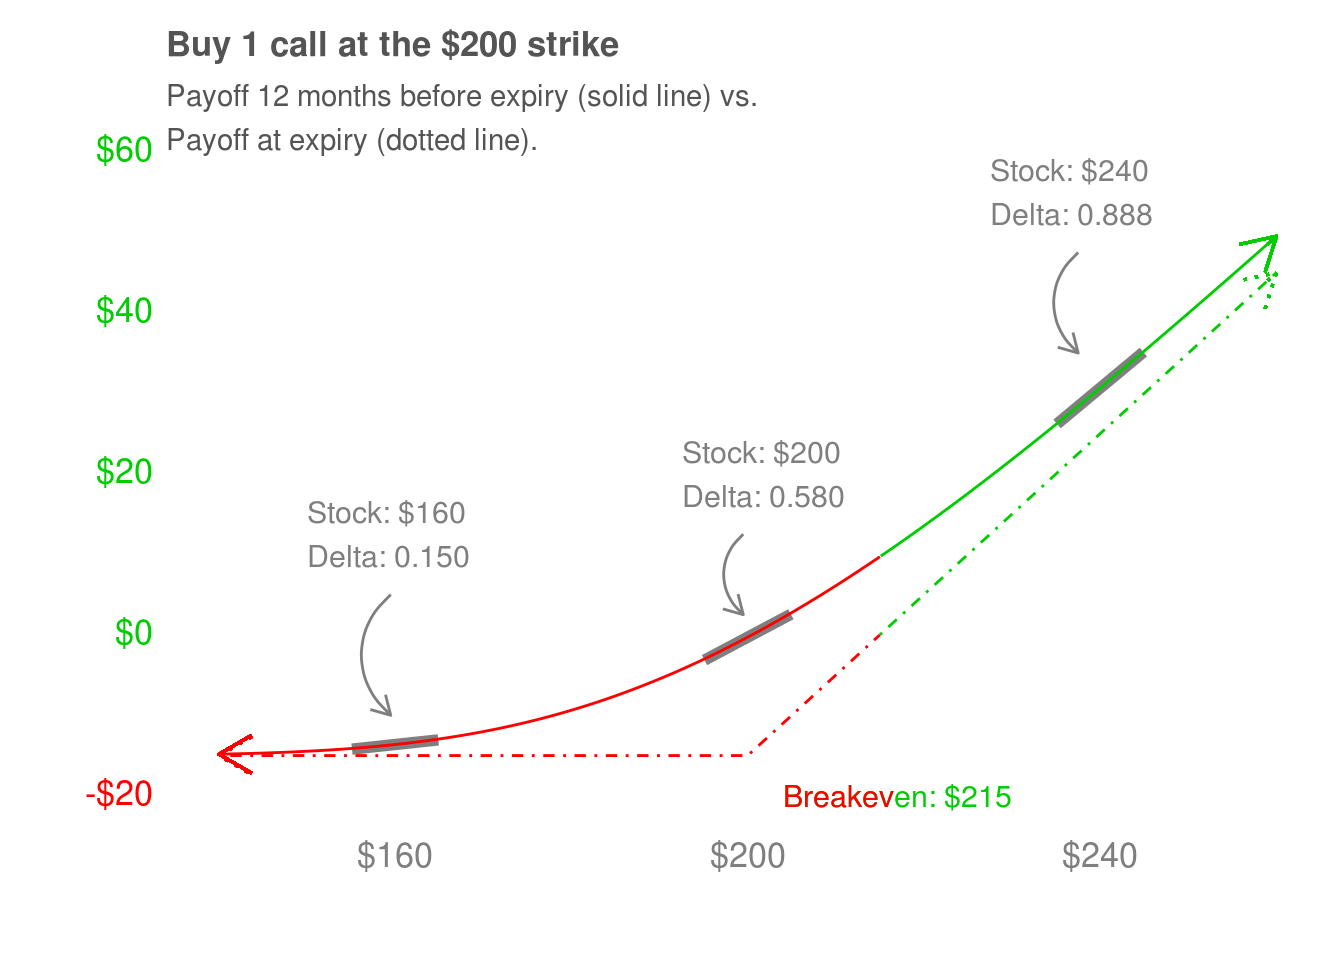 Add.
Add.
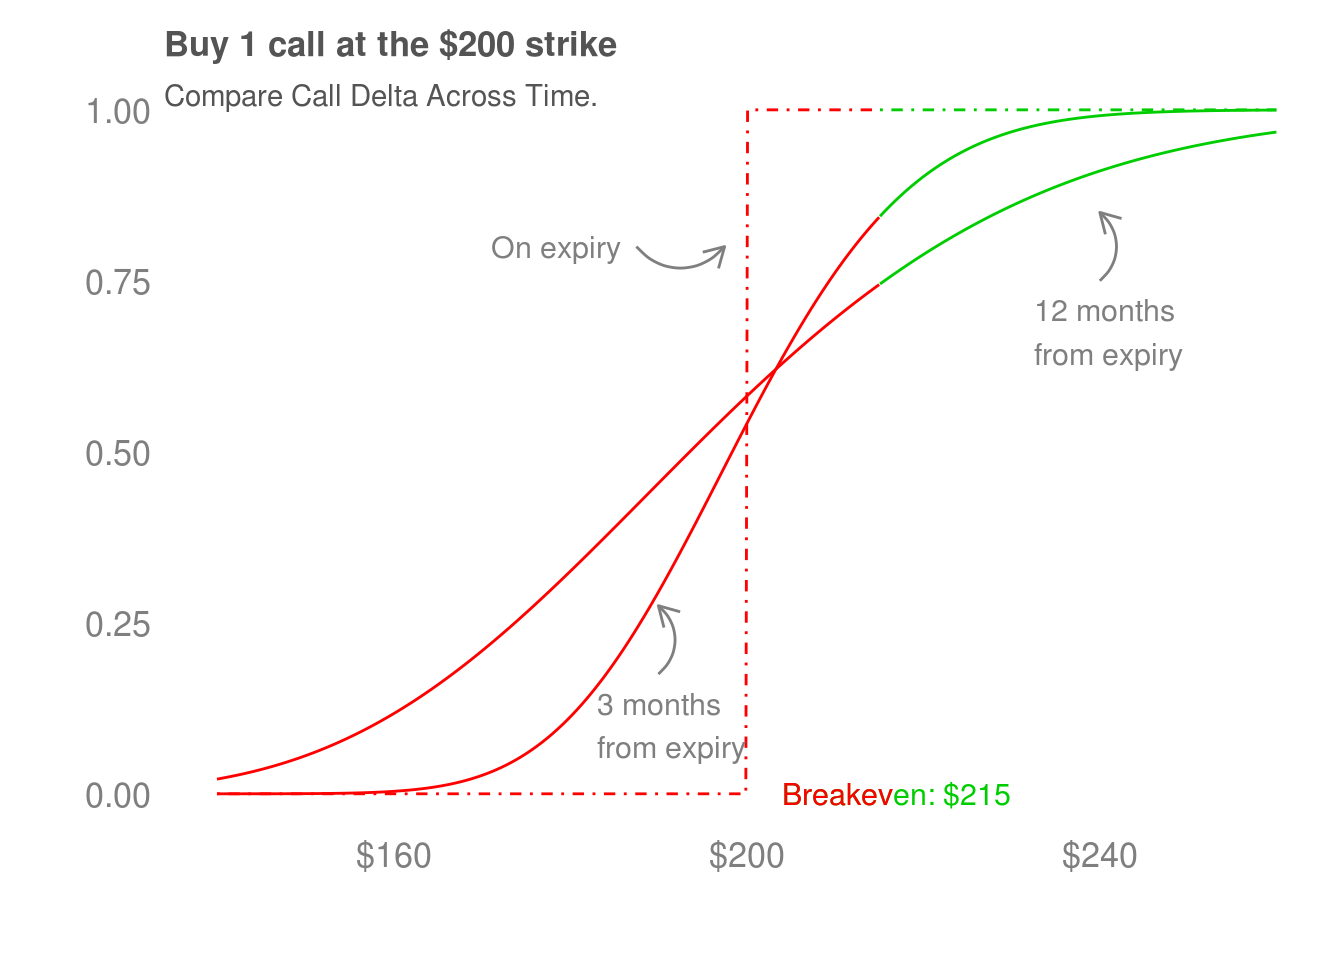
We’re going to use our knowledge of delta and gamma to construct favorable trades, and to effectively risk-manage them once we go over the three remaining greeks. Before we move on to vega, I want to emphasis that this call’s payoff diagram (before expiry) is still asymmetric. It’s not the all-or-nothing setup we saw in the first two chapters, and we don’t quite get dollar-for-dollar participation to the upside. It took an almost $15 move to the upside in XYZ’s stock to get close to that. But there’s still asymmetry: we make more and more money as the stock goes up, and lose less and less money as the stock goes down. In one way or another, all options strategies boil down to trying to exploit that asymmetry.
4.2 Gamma
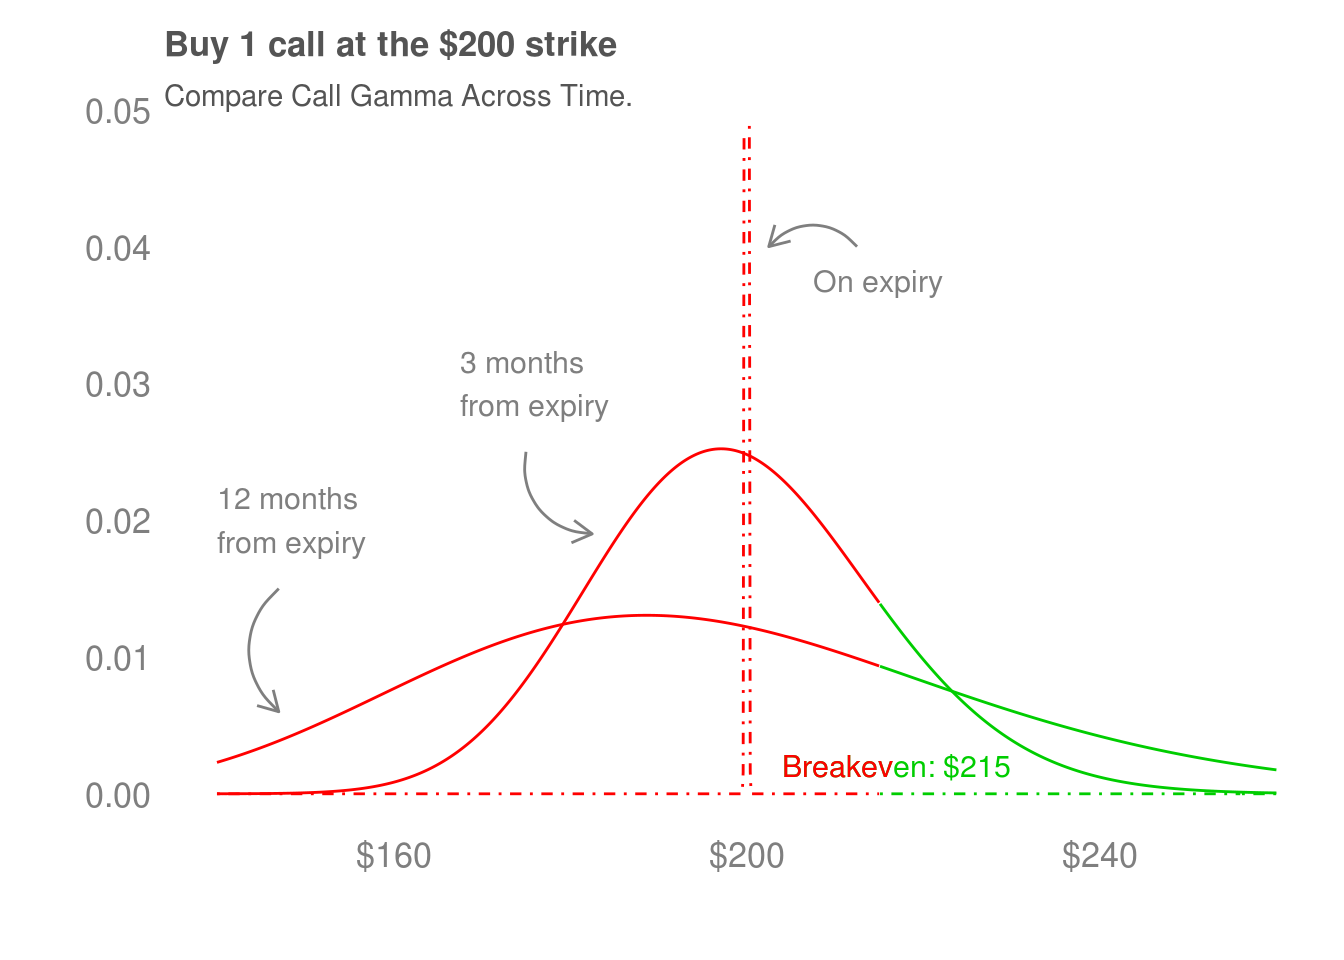
Gamma tells us how quickly our participation in the price movements of the stock changes. For example, the delta of the option 12 months from expiry changes more slowly as XYZ’s shares increase than the option that is 3 months from expiry. We can look at how quickly the delta is changing to get a sense of gamma.
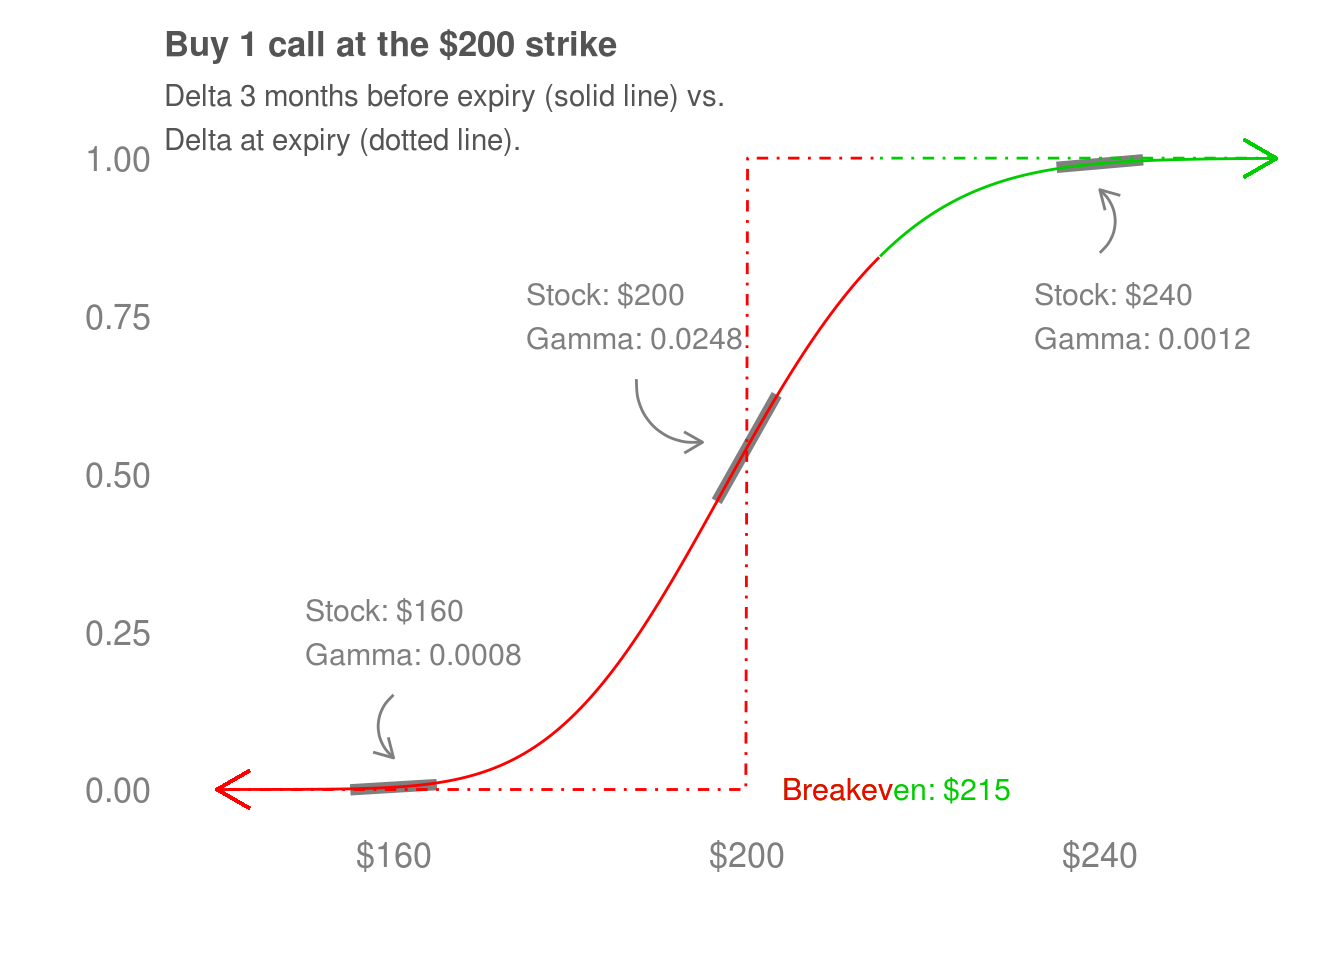
Another gamma plot.
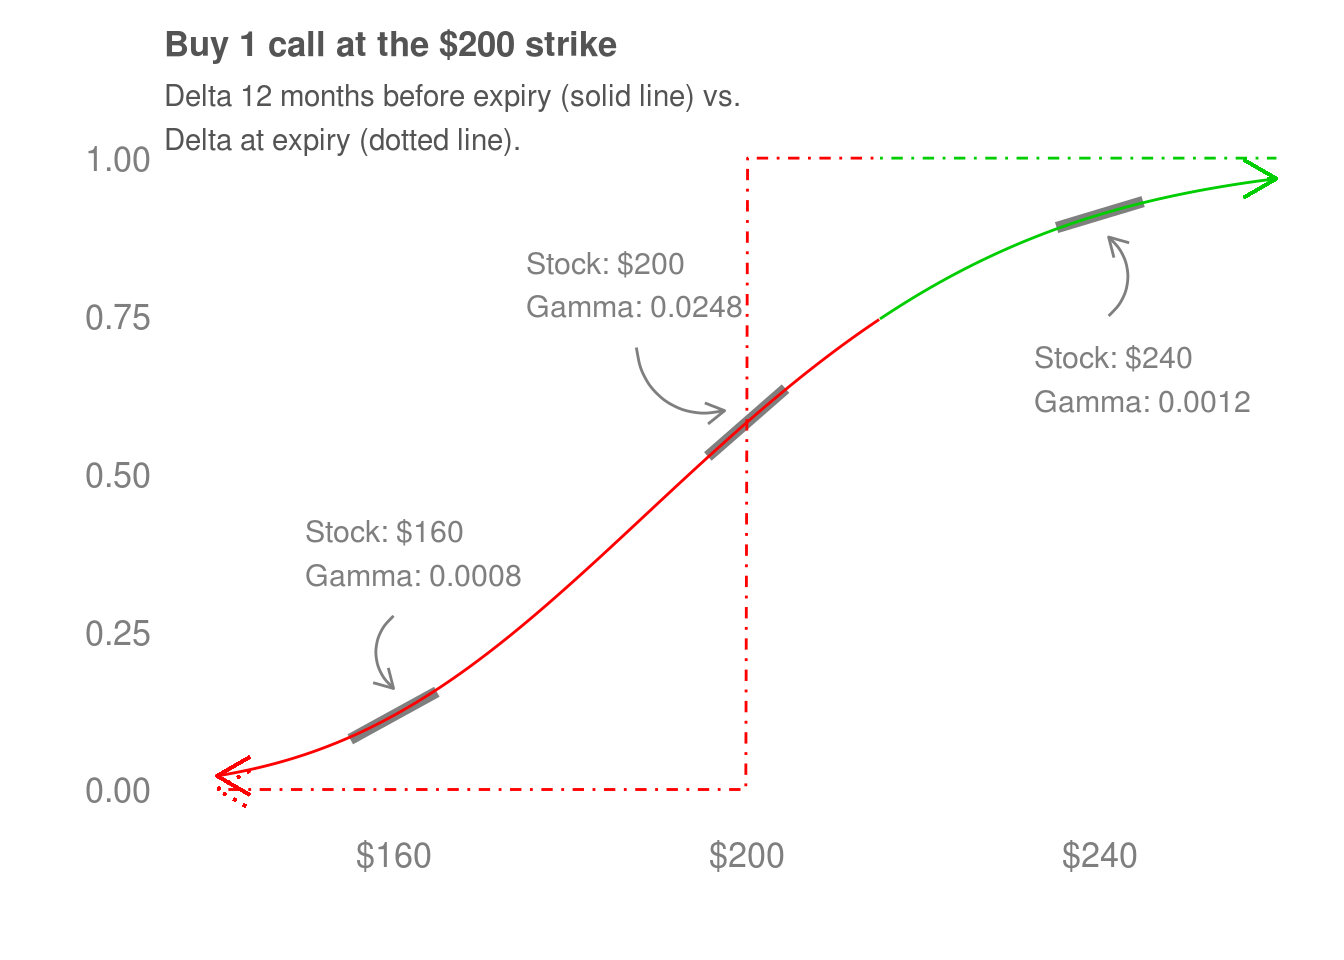
The final gamma plot
